Everything you need to
validate and monitor your strategies
Five integrated modules. 100+ metrics. Real-time monitoring.
From upload to insight in 60 seconds.
Upload your backtest. Get 100+ metrics instantly.
Plain-English insights in 60 seconds. No spreadsheet skills required.
Everything you need to understand your strategy
Performance Metrics
Get a complete picture of your strategy's performance with key metrics like profit factor, Sharpe ratio, win rate, and average trade.
Distribution Analysis
Understand the statistical distribution of your trades. See histograms, probability curves, and identify outliers.
Performance Metrics
Get a complete picture of your strategy's performance with key metrics like profit factor, Sharpe ratio, win rate, and average trade.
- •Profit factor and return on investment
- •Win rate and average win/loss
- •Risk-adjusted returns (Sharpe, Sortino)
- •Maximum drawdown and recovery time
Distribution Analysis
Understand the statistical distribution of your trades. See histograms, probability curves, and identify outliers.
- •Trade distribution histograms
- •Probability density functions
- •Outlier detection and analysis
- •Statistical moments (mean, variance, skewness)
Strategy Health Scoring
Our proprietary scoring system evaluates multiple factors to give you a single health score for your strategy.
- •Multi-factor health assessment
- •Risk-adjusted performance scoring
- •Consistency and reliability metrics
- •Actionable improvement recommendations
AI-Powered Insights
Get intelligent insights about your strategy's strengths and weaknesses, powered by advanced analytics.
- •Automated pattern detection
- •Anomaly identification
- •Performance trend analysis
- •Personalized recommendations
100+ metrics across 8 categories
Returns
12 stats
Risk
14 stats
Trade Analysis
15 stats
Time Analysis
10 stats
Streaks
8 stats
Drawdown
14 stats
Statistical
12 stats
Quality
11 stats
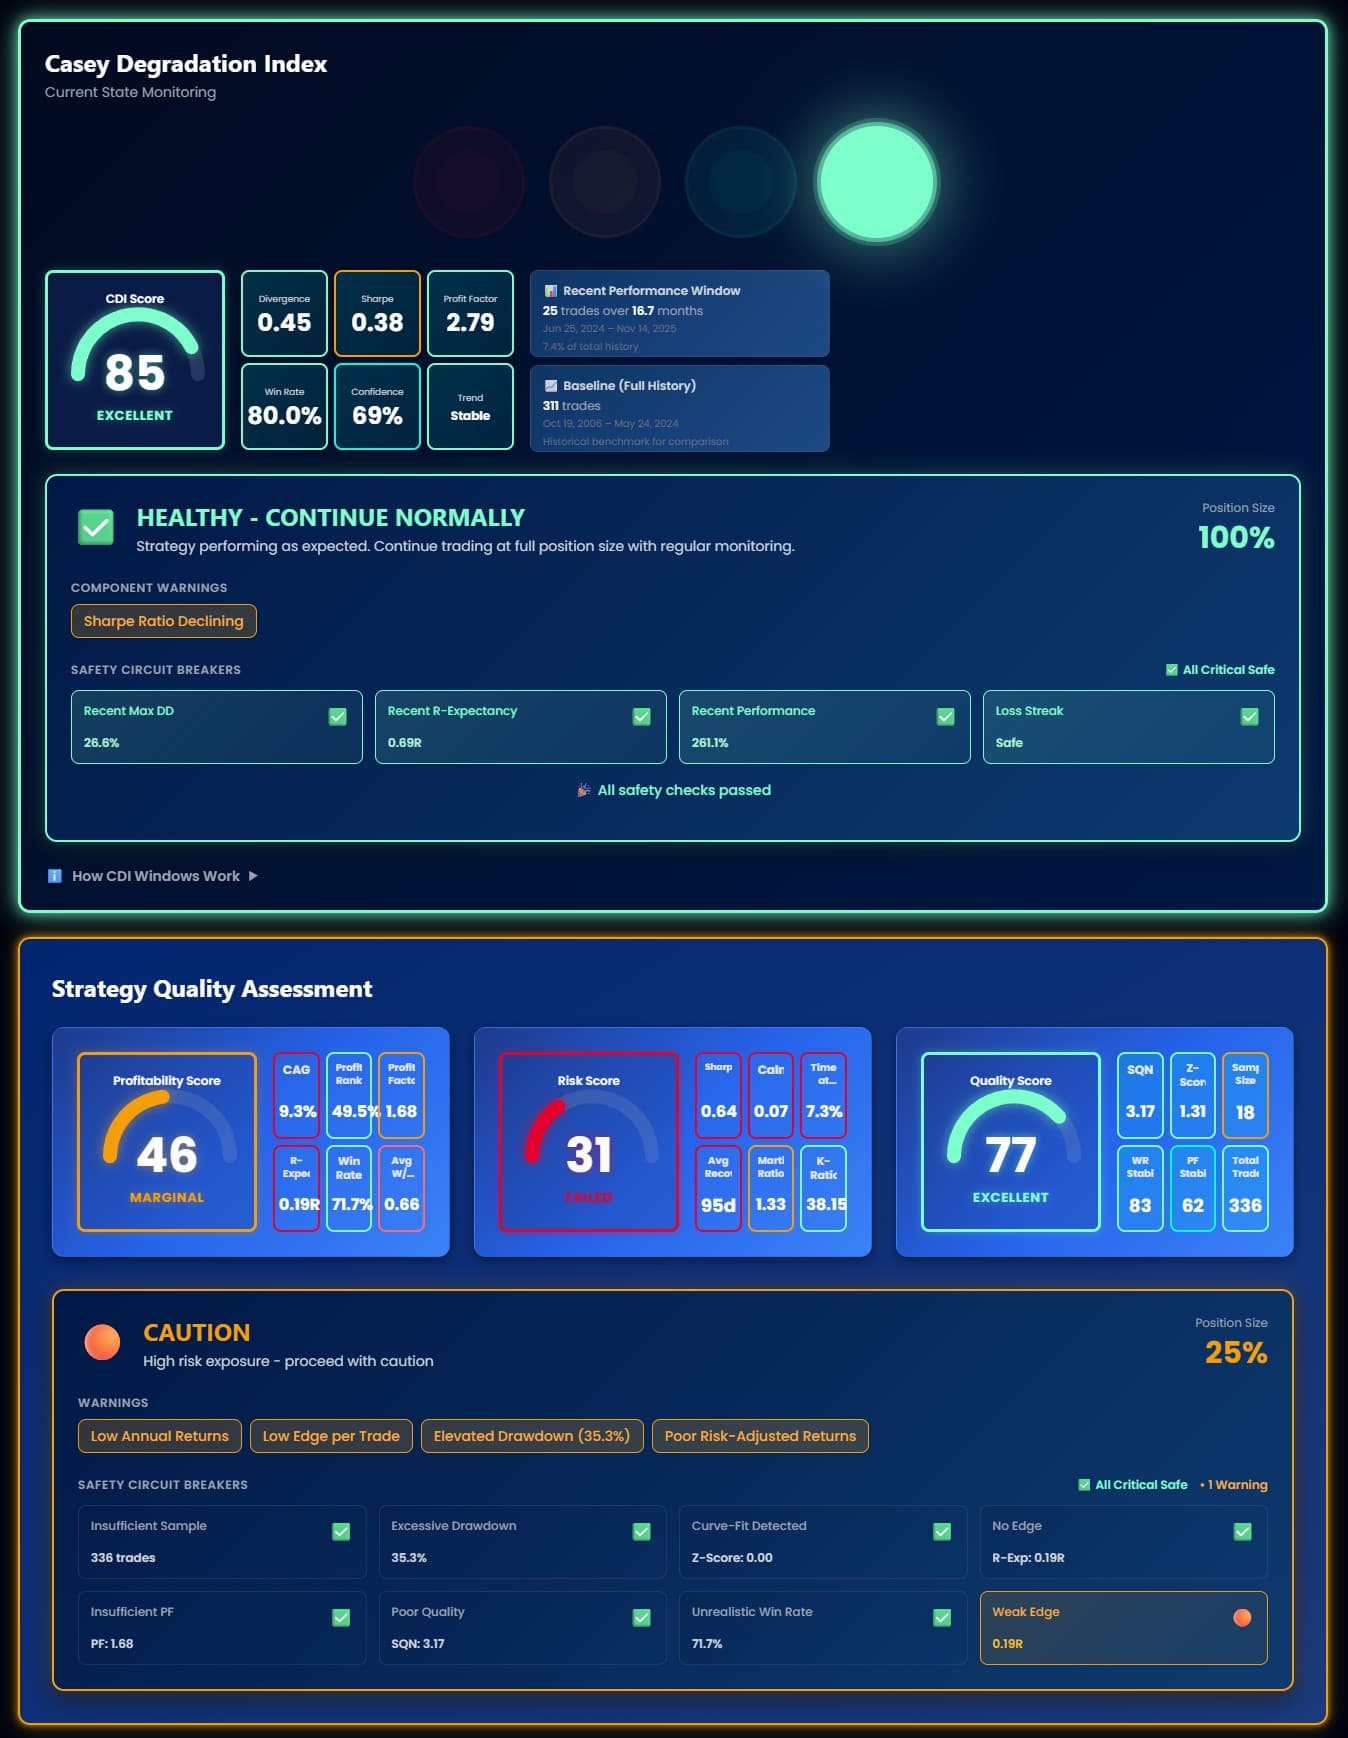
Real-time strategy health monitoring
The only platform that automatically tracks when your strategy starts breaking.
Get alerted before losses pile up.
Automated Degradation Detection
CSI scoring (0-100) tracks your strategy against statistical expectations. When performance drifts beyond normal bounds, you get alerted.
4-Tier Health Grading
Clear recommendations: Excellent, Good, Fair, or Poor. Know immediately whether to continue, monitor closely, adjust, or pause.
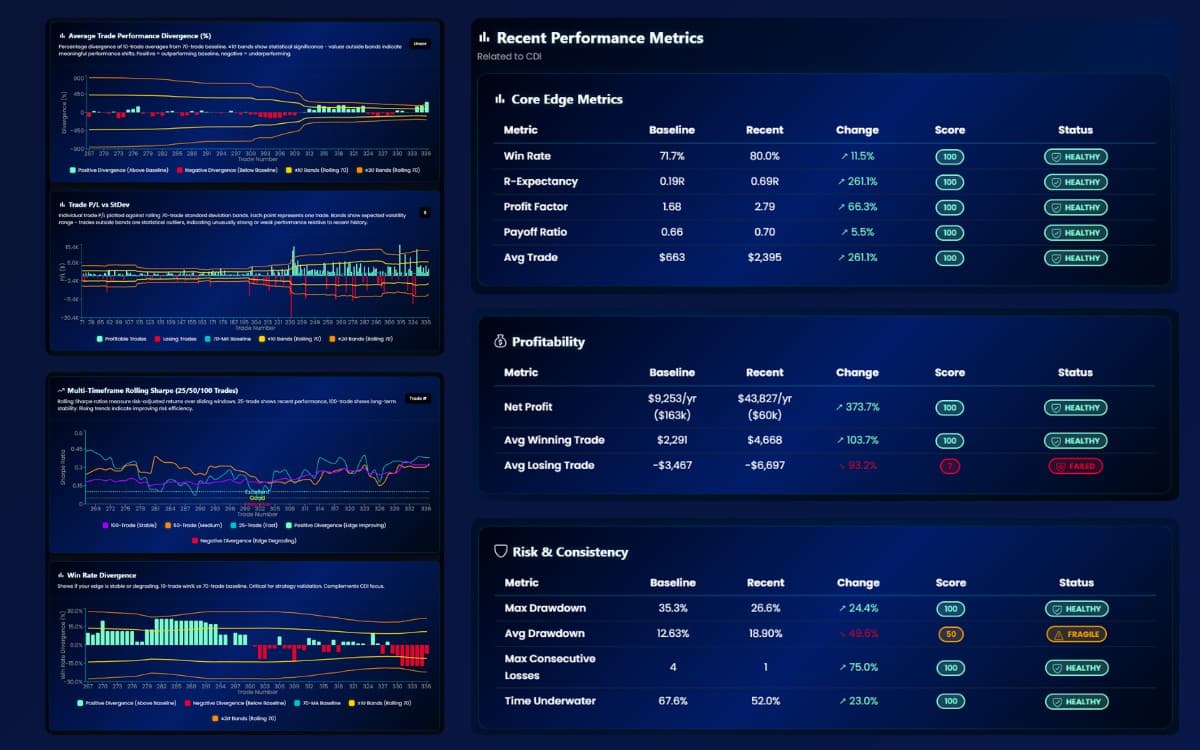
Live vs Expected Comparison
See how your live results stack up against backtest expectations in real-time. No more Excel spreadsheet tracking.
No competitor offers this
Backtesting platforms can't monitor after export. Journaling platforms only records what happened.
AlgoChef is the only platform that validates robustness AND monitors degradation.
“You could spend 4 hours/week tracking probability cones in Excel like others teaches—or let AlgoChef do it automatically.”
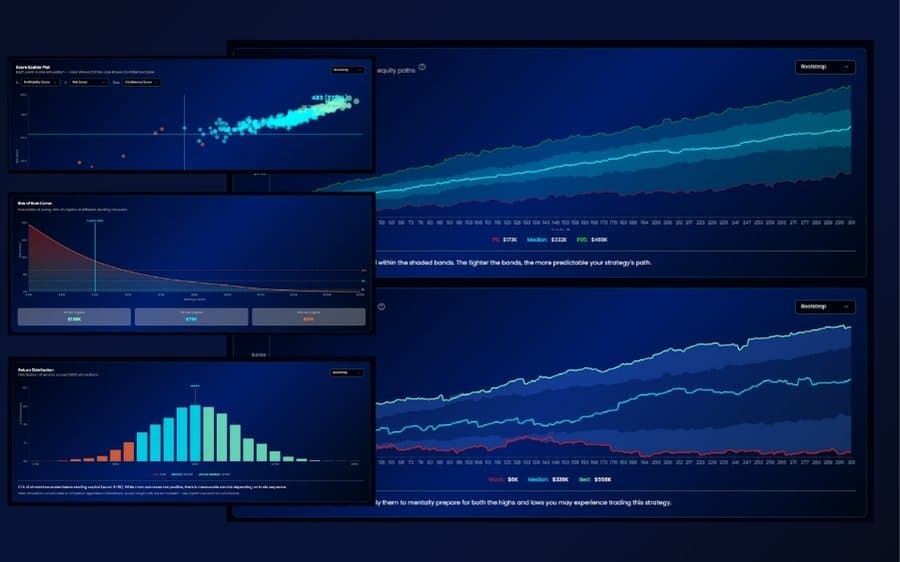
Stress-test with 250,000 simulations
Know if your edge is real or just luck. Run comprehensive simulations in seconds.
Five simulation methods for different insights
Each method reveals a different aspect of your strategy's robustness. Use them together for a complete picture.
Random Shuffle
Randomly reorders your trades to test how sequence affects performance. Great for understanding path dependency and seeing best/worst case equity curves.
Robustness Test
Is your edge real? Run thousands of simulations to see if your strategy's quality scores hold up under randomization — or collapse.
- •Robustness grade with tier stability %
- •Component breakdown (Profitability, Risk, Confidence)
- •Equity fan chart across all simulations
- •Confidence intervals on 20+ metrics
IS/OOS Validation
Does it hold out-of-sample? Automatic 75/25 split with Monte Carlo on each period to detect overfitting.
- •Health score validation
- •Method-by-method histograms
- •IS vs OOS divergence analysis
- •Overfit detection
Capital Calculator
How much do you need? Data-driven capital recommendations using Risk of Ruin and drawdown probability curves.
- •Dual curve chart (RoR + drawdown)
- •Goal Seek finds optimal capital
- •Margin-aware recommendations
- •Configurable risk parameters
Stress Testing
Can it survive the worst? Seven scenarios progressively degrade your strategy to find its breaking point.
- •Survivability Score (0–100)
- •7 predefined stress scenarios
- •Per-scenario survival rates
- •Capital adequacy assessment
Compare, benchmark, and pick the winners
See if you're generating real alpha, analyze crisis dependency, and compare strategies head-to-head — all in one module.
Strategy vs Benchmark
Compare your strategy against S&P 500, NASDAQ, and 15+ market benchmarks. Measure alpha, beta, information ratio, capture ratios, and statistical significance.
Learn moreCrisis Dependency
Does your strategy need market crashes to be profitable? Dependency scoring across 11 preset crisis zones plus custom zones, with permutation testing.
Learn moreHead-to-Head
Pit 2–4 strategies against each other. Frozen metric snapshots, rebased equity curves, radar charts, and an automatic verdict. Share results with a public link.
Learn morePortfolio Studio
Coming Soon
Combine strategies and optimize allocation. See how they work together.
Correlation Analysis
Trade Only N of M Strategies
What-If Scenarios
Allocation Optimization
Be the first to know when Portfolio Studio launches
Stop guessing.
Start knowing.
Join the waitlist for free beta access. Be first to validate your strategies with institutional-grade tools.
Trade smarter with institutional tools—no guesswork, no barriers.